> ## Documentation Index
> Fetch the complete documentation index at: https://help.reevo.ai/llms.txt
> Use this file to discover all available pages before exploring further.
# Pipeline Waterfall Chart
> See exactly how your open pipeline changed between two dates - and why.
# Overview
The Pipeline Waterfall chart answers one question: **"Why did my pipeline change?"**
It compares your open pipeline at two points in time, classifies each deal based on what happened between those points, and shows the net dollar impact of each type of change. The result always balances: your starting pipeline plus every gain minus every loss equals your ending pipeline. The chart is denominated in USD.
## How to Read the Pipeline Waterfall Chart
Bars appear left to right in a fixed order. The first and last bars are gray and show your opening and closing pipeline totals. Everything in between explains the movement.
**Bar colors:**
* **Gray** - Start and End. Absolute totals, not changes.
* **Green** - Deals that added to your pipeline:
* **Created** (new deals)
* **Pulled In** (existing deals that entered the window)
* **Amount Increased** (deal values that went up)
* **Red** - Deals that reduced your pipeline:
* **Amount Decreased** (deal values that went down)
* **Pushed Out** (anticipated close date moved outside the window)
* **Lost** (closed lost)
* **Won** (closed won - removed from open pipeline)
The chart balance:
> Start + (Created + Pulled In + Amount Increased) - (Amount Decreased + Pushed Out + Lost + Won) = End
Data labels above each bar show the net dollar amount in compact format (e.g., \$42k, \$1.2M).
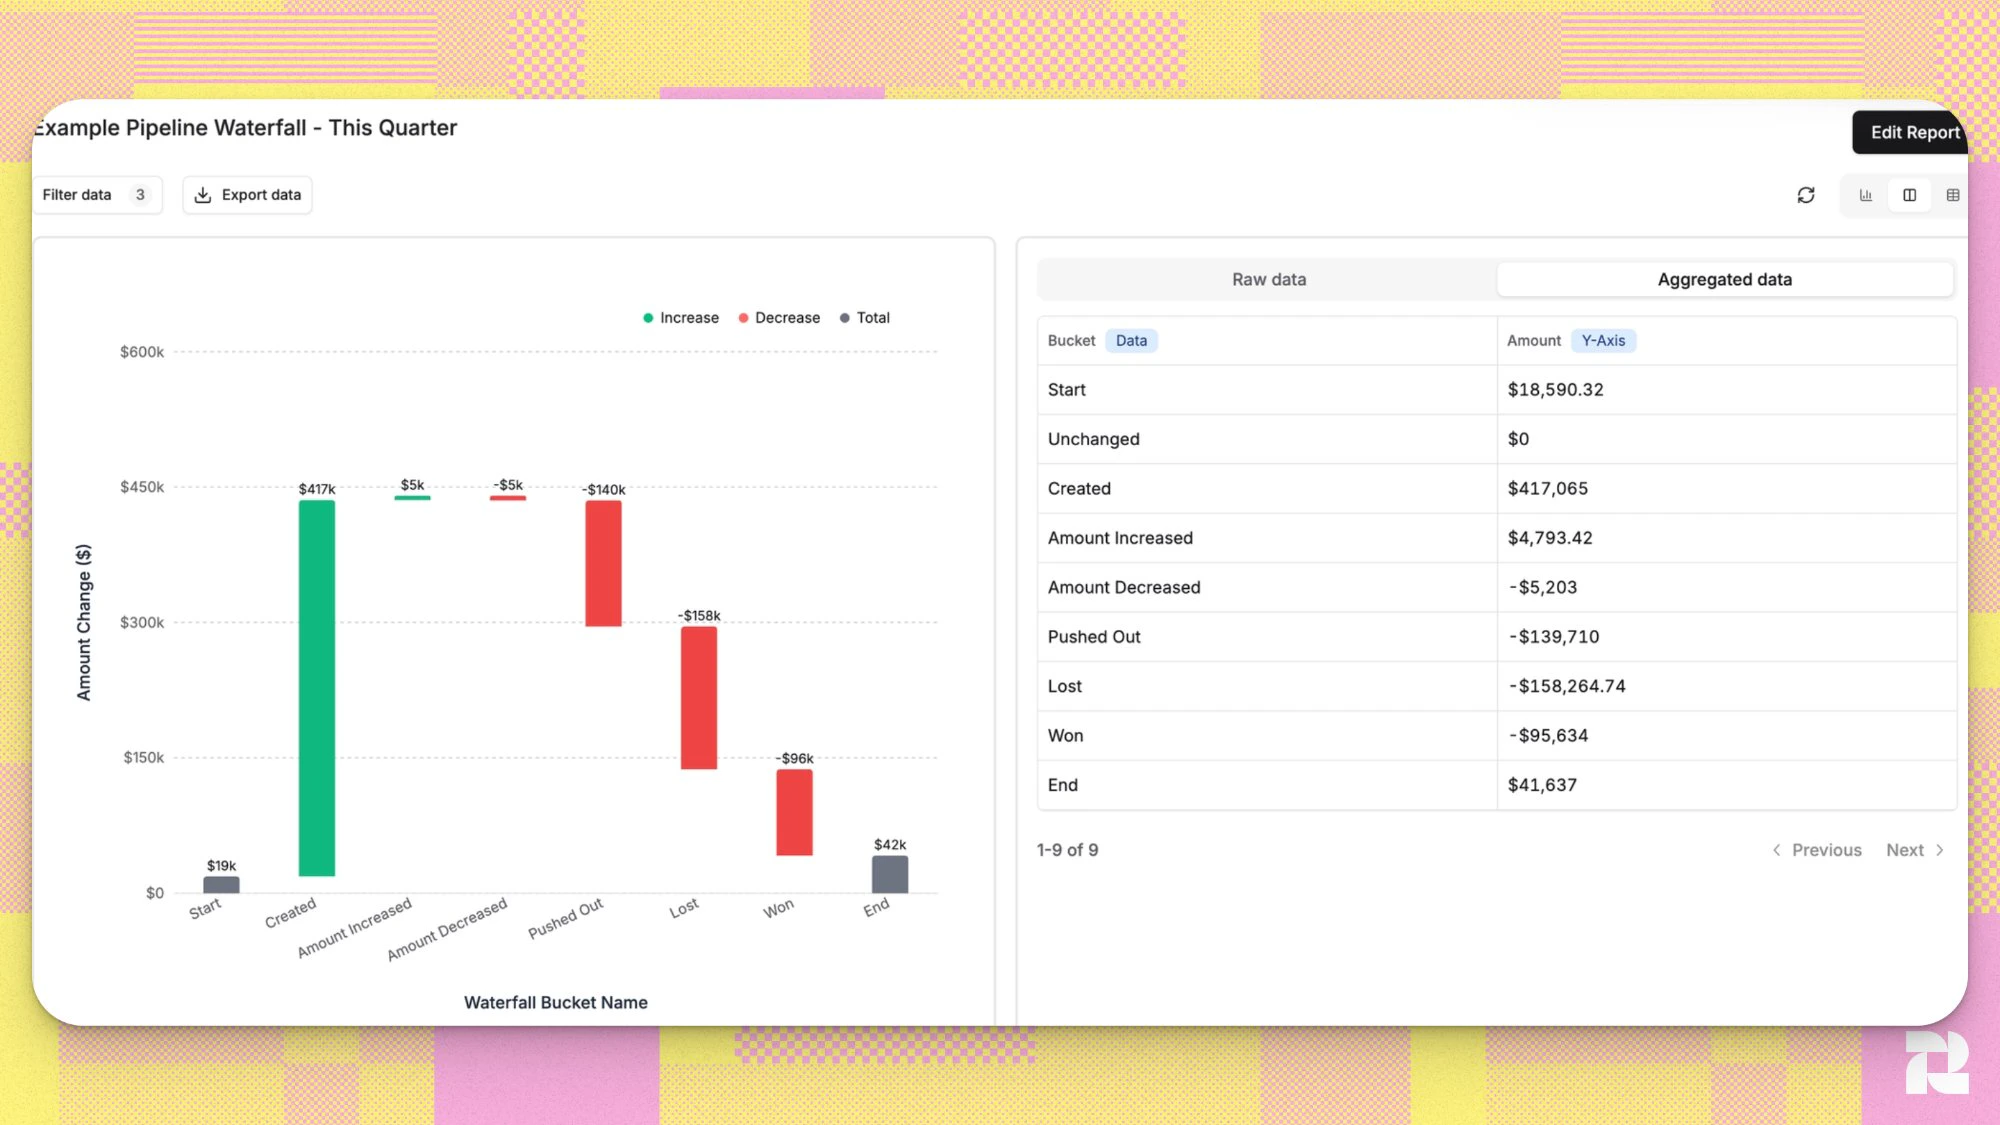 In the example above, the pipeline started at \$19k, gained \$422k from new deals and amount increases (+\$417k created, +\$5k increased), and lost \$394k through pushed-out deals (-\$140k), lost deals (-\$158k), and closed-won deals (-\$96k), ending the quarter at \$42k.
### Waterfall Buckets
The chart uses ten buckets. A deal can appear in more than one bucket when multiple things changed during the period - for example, a deal that was pulled into the window and then closed lost will appear in both Pulled In and Lost.
| Bucket | What it means | Bar color | Amount contribution |
| -------------------- | ------------------------------------------------------------------------------------------------------------------------------------------------------------------------------ | --------- | -------------------------------------- |
| **Start** | Open deals with a close date inside the window at the start of the period. Your opening balance. | Gray | = Start Amount |
| **Unchanged** | Open deals in-window at both snapshots with no amount change. Contributes \$0 - hidden from the chart, visible in table view only. | None | = 0 |
| **Created** | New deals created during the period with a close date in the window. | Green | = End Amount |
| **Pulled In** | Existing deals that were not in the starting pipeline but entered it during the period. Covers: close date moved into the window, deal reopened, or deal reopened then closed. | Green | = Start Amount |
| **Amount Increased** | Tracked deals whose net amount went up between the two snapshots. | Green | = End Amount - Start Amount |
| **Amount Decreased** | Tracked deals whose net amount went down between the two snapshots. | Red | = End Amount - Start Amount (negative) |
| **Pushed Out** | Deals whose close date moved outside the window and are still open at the end of the period. | Red | = -End Amount |
| **Lost** | Deals that became Closed Lost during the period and were relevant to the pipeline. | Red | = -End Amount |
| **Won** | Deals that became Closed Won during the period. Won deals are removed from open pipeline. | Red | = -End Amount |
| **End** | Open deals with a close date inside the window at the end of the period. Your closing balance. | Gray | = End Amount |
***
### The Two Time Filters
The Pipeline Waterfall requires two date filters that serve different purposes. Understanding both is essential before interpreting the chart.
**Snapshot Date** answers: *When did changes happen?*
This is your observation window. The lower boundary is the "before" snapshot; the upper boundary is the "after" snapshot. The chart reconstructs each deal's stage, amount, and close date at each boundary using field history.
**Close Date Window** answers: *Which deals are we tracking?*
This defines the group of deals you care about, based on their anticipated close date. Only deals whose close date falls inside this range - at the start snapshot, the end snapshot, or at any point during the period - are included.
**Example:**
* Snapshot Date: March 1 - March 31
* Close Date Window: Q2 2026 (April 1 - June 30)
This shows everything that happened during March to deals expected to close in Q2. A deal that moved its close date from April into July during March would appear in the **Pushed Out** bucket.
Both filters default to **This Quarter** when you create a new report.
***
# Step-by-Step Instructions
## Creating a Pipeline Waterfall Report
1. Go to **Reporting**.
2. Click **Create** - **Report**.
In the example above, the pipeline started at \$19k, gained \$422k from new deals and amount increases (+\$417k created, +\$5k increased), and lost \$394k through pushed-out deals (-\$140k), lost deals (-\$158k), and closed-won deals (-\$96k), ending the quarter at \$42k.
### Waterfall Buckets
The chart uses ten buckets. A deal can appear in more than one bucket when multiple things changed during the period - for example, a deal that was pulled into the window and then closed lost will appear in both Pulled In and Lost.
| Bucket | What it means | Bar color | Amount contribution |
| -------------------- | ------------------------------------------------------------------------------------------------------------------------------------------------------------------------------ | --------- | -------------------------------------- |
| **Start** | Open deals with a close date inside the window at the start of the period. Your opening balance. | Gray | = Start Amount |
| **Unchanged** | Open deals in-window at both snapshots with no amount change. Contributes \$0 - hidden from the chart, visible in table view only. | None | = 0 |
| **Created** | New deals created during the period with a close date in the window. | Green | = End Amount |
| **Pulled In** | Existing deals that were not in the starting pipeline but entered it during the period. Covers: close date moved into the window, deal reopened, or deal reopened then closed. | Green | = Start Amount |
| **Amount Increased** | Tracked deals whose net amount went up between the two snapshots. | Green | = End Amount - Start Amount |
| **Amount Decreased** | Tracked deals whose net amount went down between the two snapshots. | Red | = End Amount - Start Amount (negative) |
| **Pushed Out** | Deals whose close date moved outside the window and are still open at the end of the period. | Red | = -End Amount |
| **Lost** | Deals that became Closed Lost during the period and were relevant to the pipeline. | Red | = -End Amount |
| **Won** | Deals that became Closed Won during the period. Won deals are removed from open pipeline. | Red | = -End Amount |
| **End** | Open deals with a close date inside the window at the end of the period. Your closing balance. | Gray | = End Amount |
***
### The Two Time Filters
The Pipeline Waterfall requires two date filters that serve different purposes. Understanding both is essential before interpreting the chart.
**Snapshot Date** answers: *When did changes happen?*
This is your observation window. The lower boundary is the "before" snapshot; the upper boundary is the "after" snapshot. The chart reconstructs each deal's stage, amount, and close date at each boundary using field history.
**Close Date Window** answers: *Which deals are we tracking?*
This defines the group of deals you care about, based on their anticipated close date. Only deals whose close date falls inside this range - at the start snapshot, the end snapshot, or at any point during the period - are included.
**Example:**
* Snapshot Date: March 1 - March 31
* Close Date Window: Q2 2026 (April 1 - June 30)
This shows everything that happened during March to deals expected to close in Q2. A deal that moved its close date from April into July during March would appear in the **Pushed Out** bucket.
Both filters default to **This Quarter** when you create a new report.
***
# Step-by-Step Instructions
## Creating a Pipeline Waterfall Report
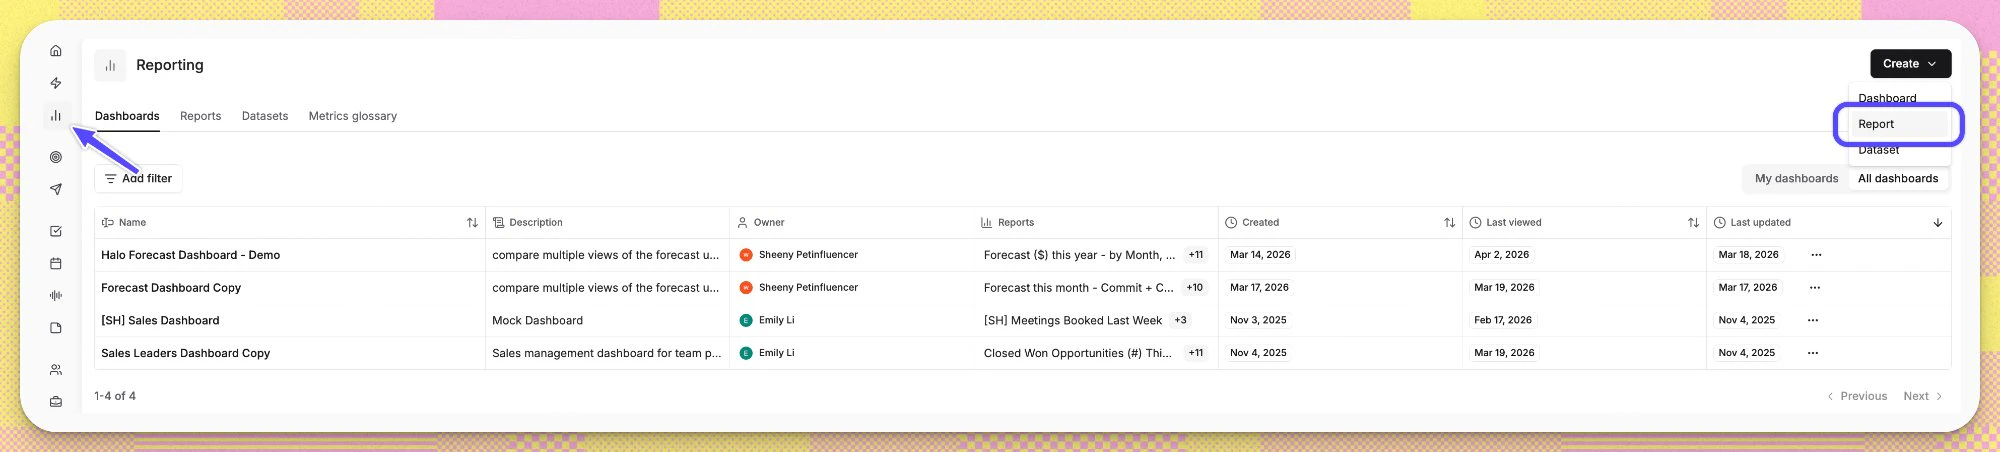
1. Go to **Reporting**.
2. Click **Create** - **Report**.
 3. Select **Pipeline Waterfall** as the chart type.
4. The report opens with **Snapshot Date** and **Close Date Window** both set to This Quarter.
3. Select **Pipeline Waterfall** as the chart type.
4. The report opens with **Snapshot Date** and **Close Date Window** both set to This Quarter.
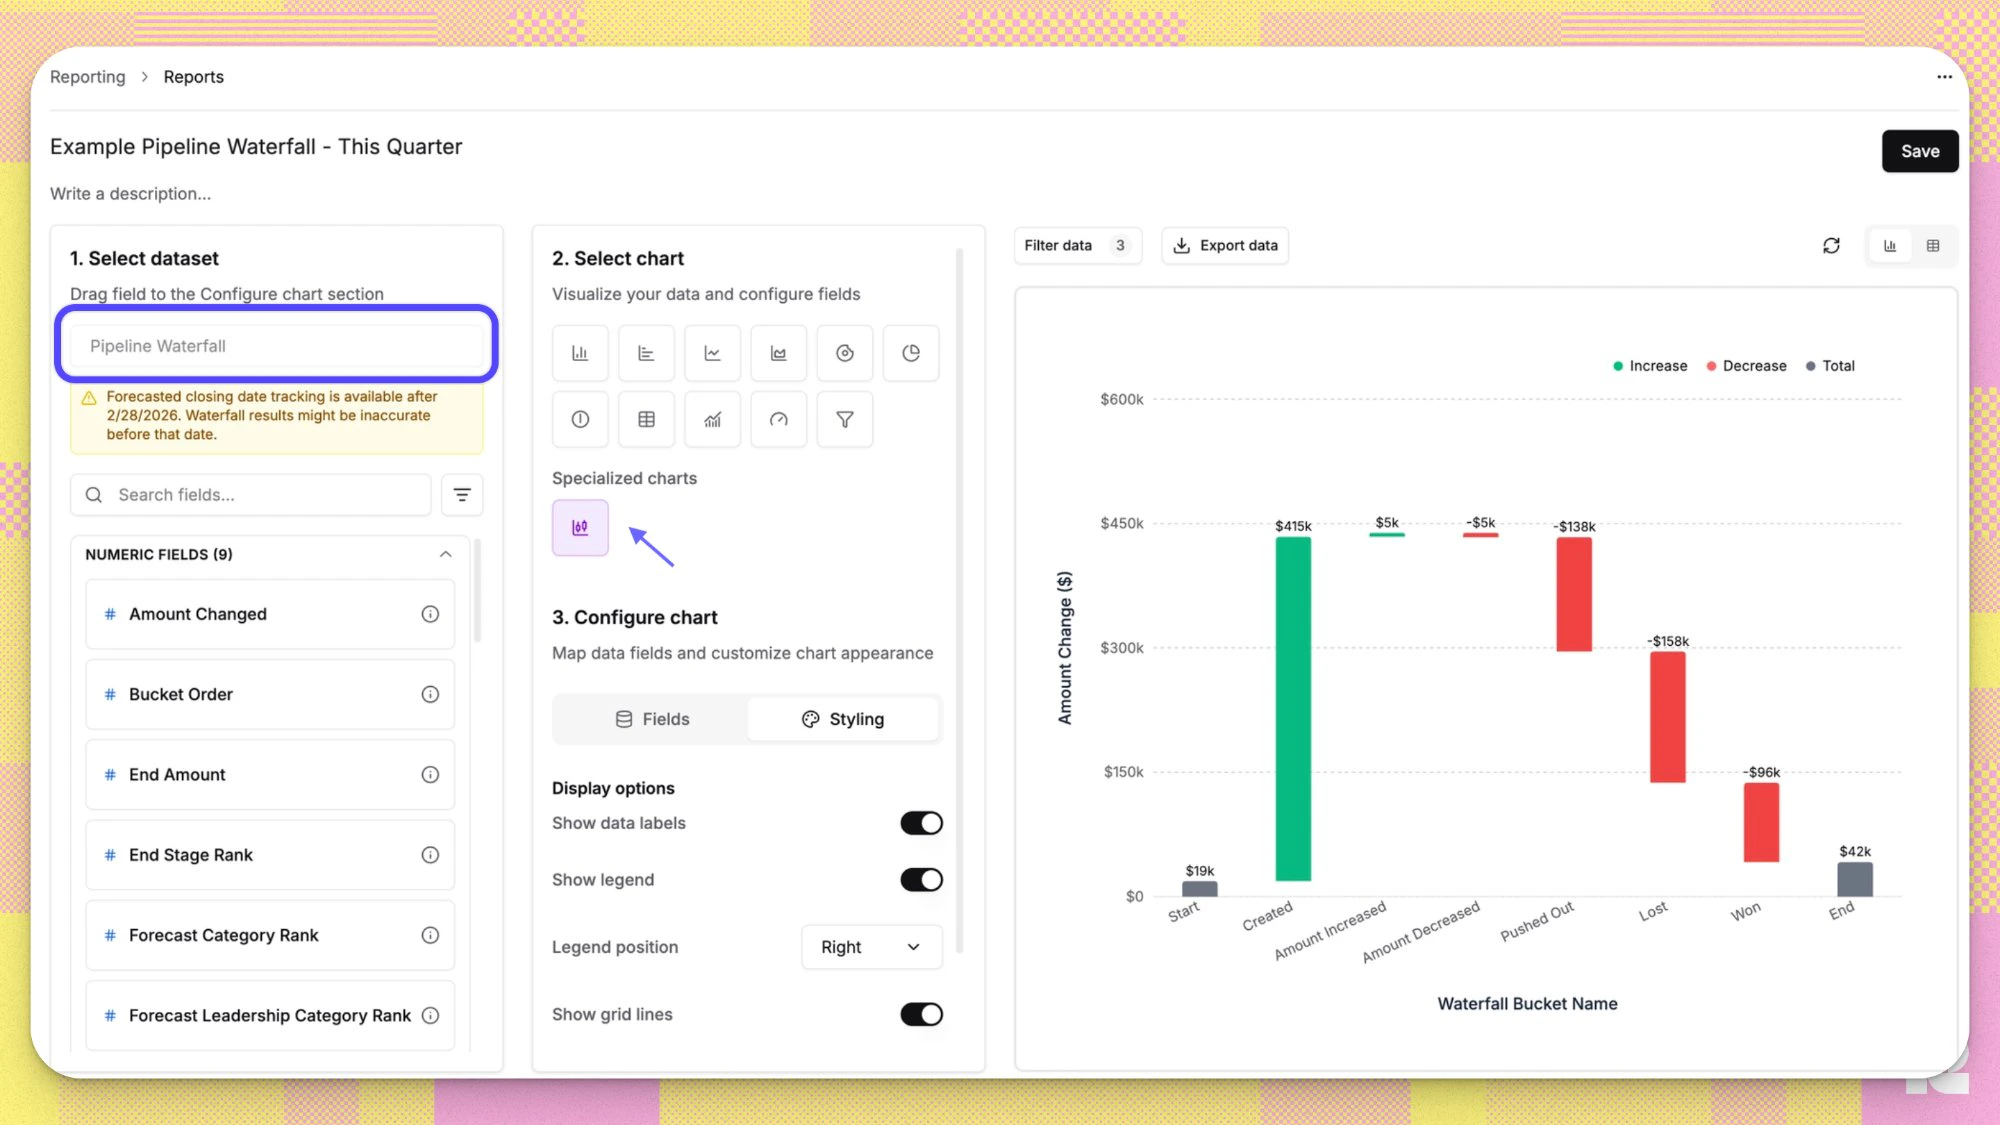 The waterfall chart shows the aggregated amounts with signs for each bucket, from positive (created, pulled in, amount increased) amounts on the left to negative amounts to the right.
For general report setup (saving, naming, adding to dashboards) see [Building Reports from Datasets](/Analytics-and-Reporting/building-reports-from-datasets).
***
## Adjusting Filters
1. Click **Filters** - **Add condition**.
2. Select **Snapshot Date** and set the period you want to analyze (e.g., last month, last quarter).
3. Select **Close Date Window** and set the deals you want to track (e.g., this quarter, next quarter).
The waterfall chart shows the aggregated amounts with signs for each bucket, from positive (created, pulled in, amount increased) amounts on the left to negative amounts to the right.
For general report setup (saving, naming, adding to dashboards) see [Building Reports from Datasets](/Analytics-and-Reporting/building-reports-from-datasets).
***
## Adjusting Filters
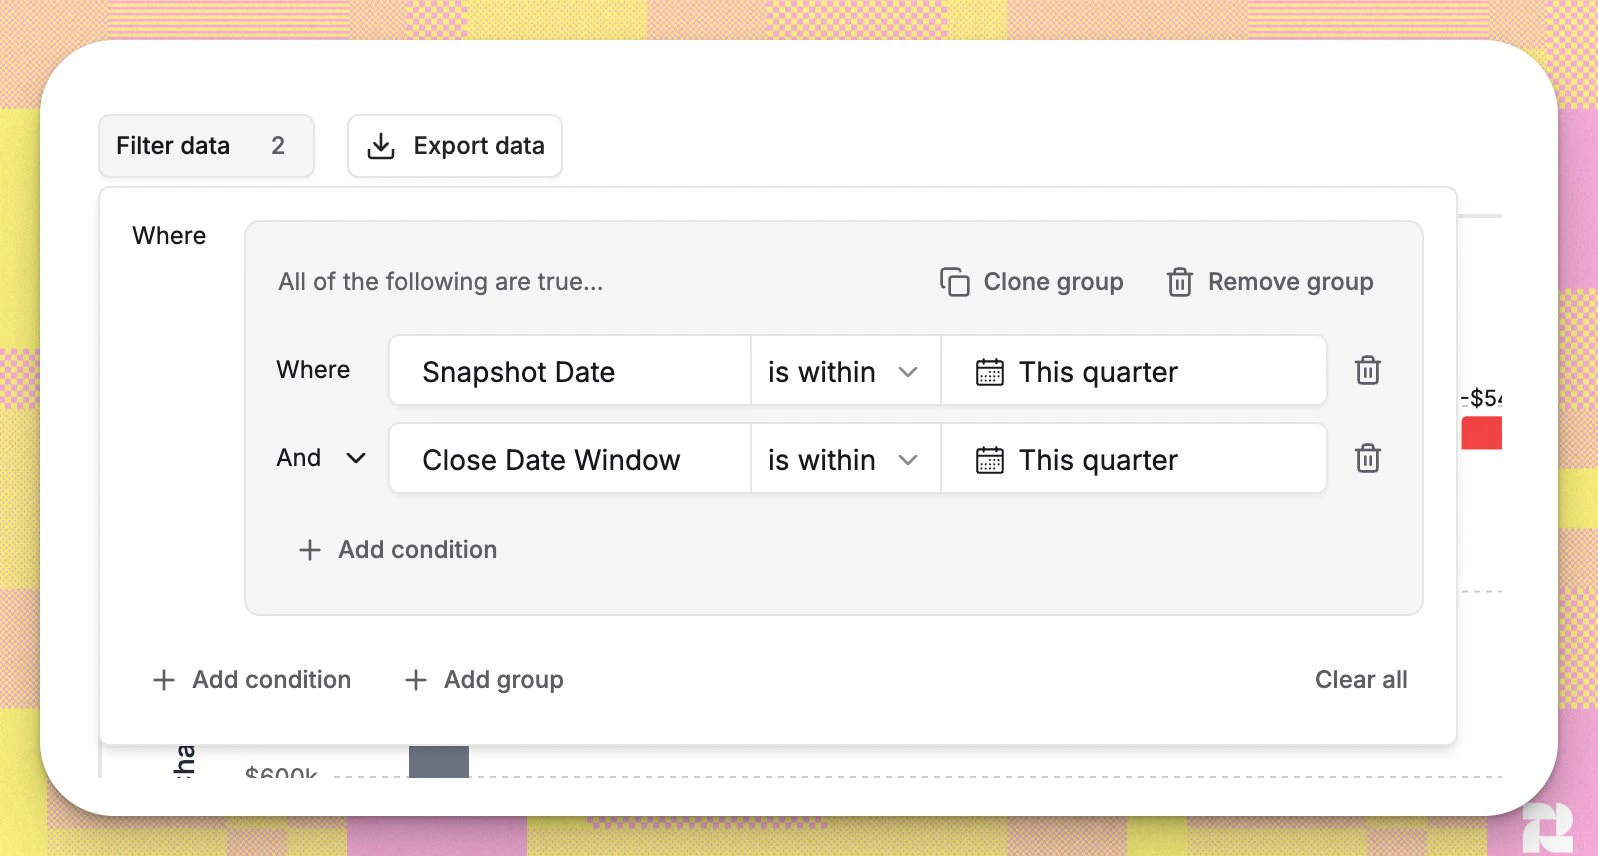
1. Click **Filters** - **Add condition**.
2. Select **Snapshot Date** and set the period you want to analyze (e.g., last month, last quarter).
3. Select **Close Date Window** and set the deals you want to track (e.g., this quarter, next quarter).
 ### Optional Filters
| Filter | What it does |
| ----------------------------------- | ----------------------------------------------------------------------------- |
| **Pipeline** | Scope to a specific pipeline. When absent, uses the default pipeline. |
| **Owner** | Filter by the current opportunity owner. |
| **Forecast Category** | Filter by the opportunity's current rep forecast category. |
| **Forecast Leadership Category** | Filter by the opportunity's current leadership forecast category. |
| **Stage Default Forecast Category** | Filter by the forecast category derived from the opportunity's current stage. |
| **Opportunity** | Narrow to a single specific opportunity. |
***
## Drilling Down Into a Bucket
There are two ways to further explore each bucket:
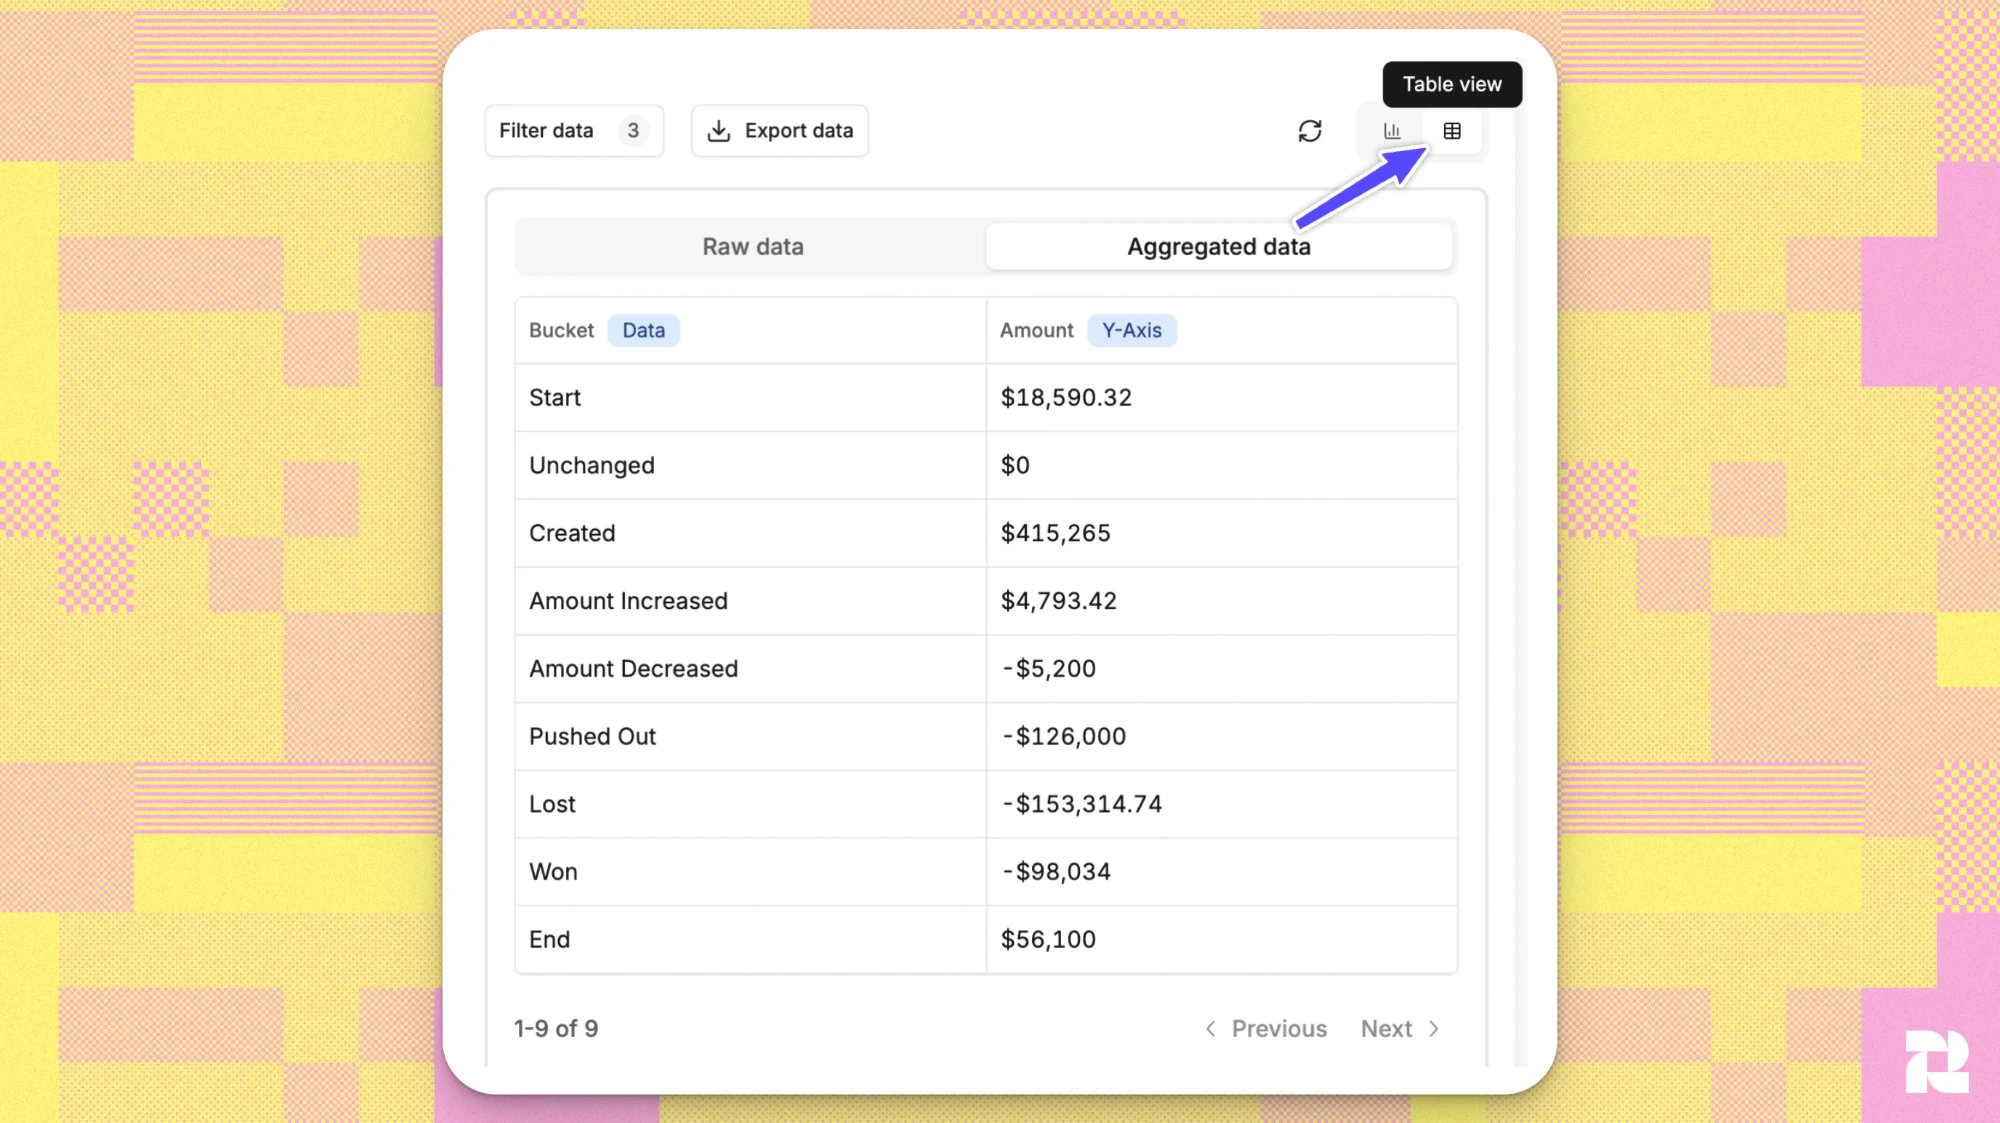
1. To view aggregated data, select **Table view** in the top right corner.
### Optional Filters
| Filter | What it does |
| ----------------------------------- | ----------------------------------------------------------------------------- |
| **Pipeline** | Scope to a specific pipeline. When absent, uses the default pipeline. |
| **Owner** | Filter by the current opportunity owner. |
| **Forecast Category** | Filter by the opportunity's current rep forecast category. |
| **Forecast Leadership Category** | Filter by the opportunity's current leadership forecast category. |
| **Stage Default Forecast Category** | Filter by the forecast category derived from the opportunity's current stage. |
| **Opportunity** | Narrow to a single specific opportunity. |
***
## Drilling Down Into a Bucket
There are two ways to further explore each bucket:
1. To view aggregated data, select **Table view** in the top right corner.
 2. To view what opportunities make up a bucket, hover over any bar and click. Each row is one opportunity. Click any column header to sort.
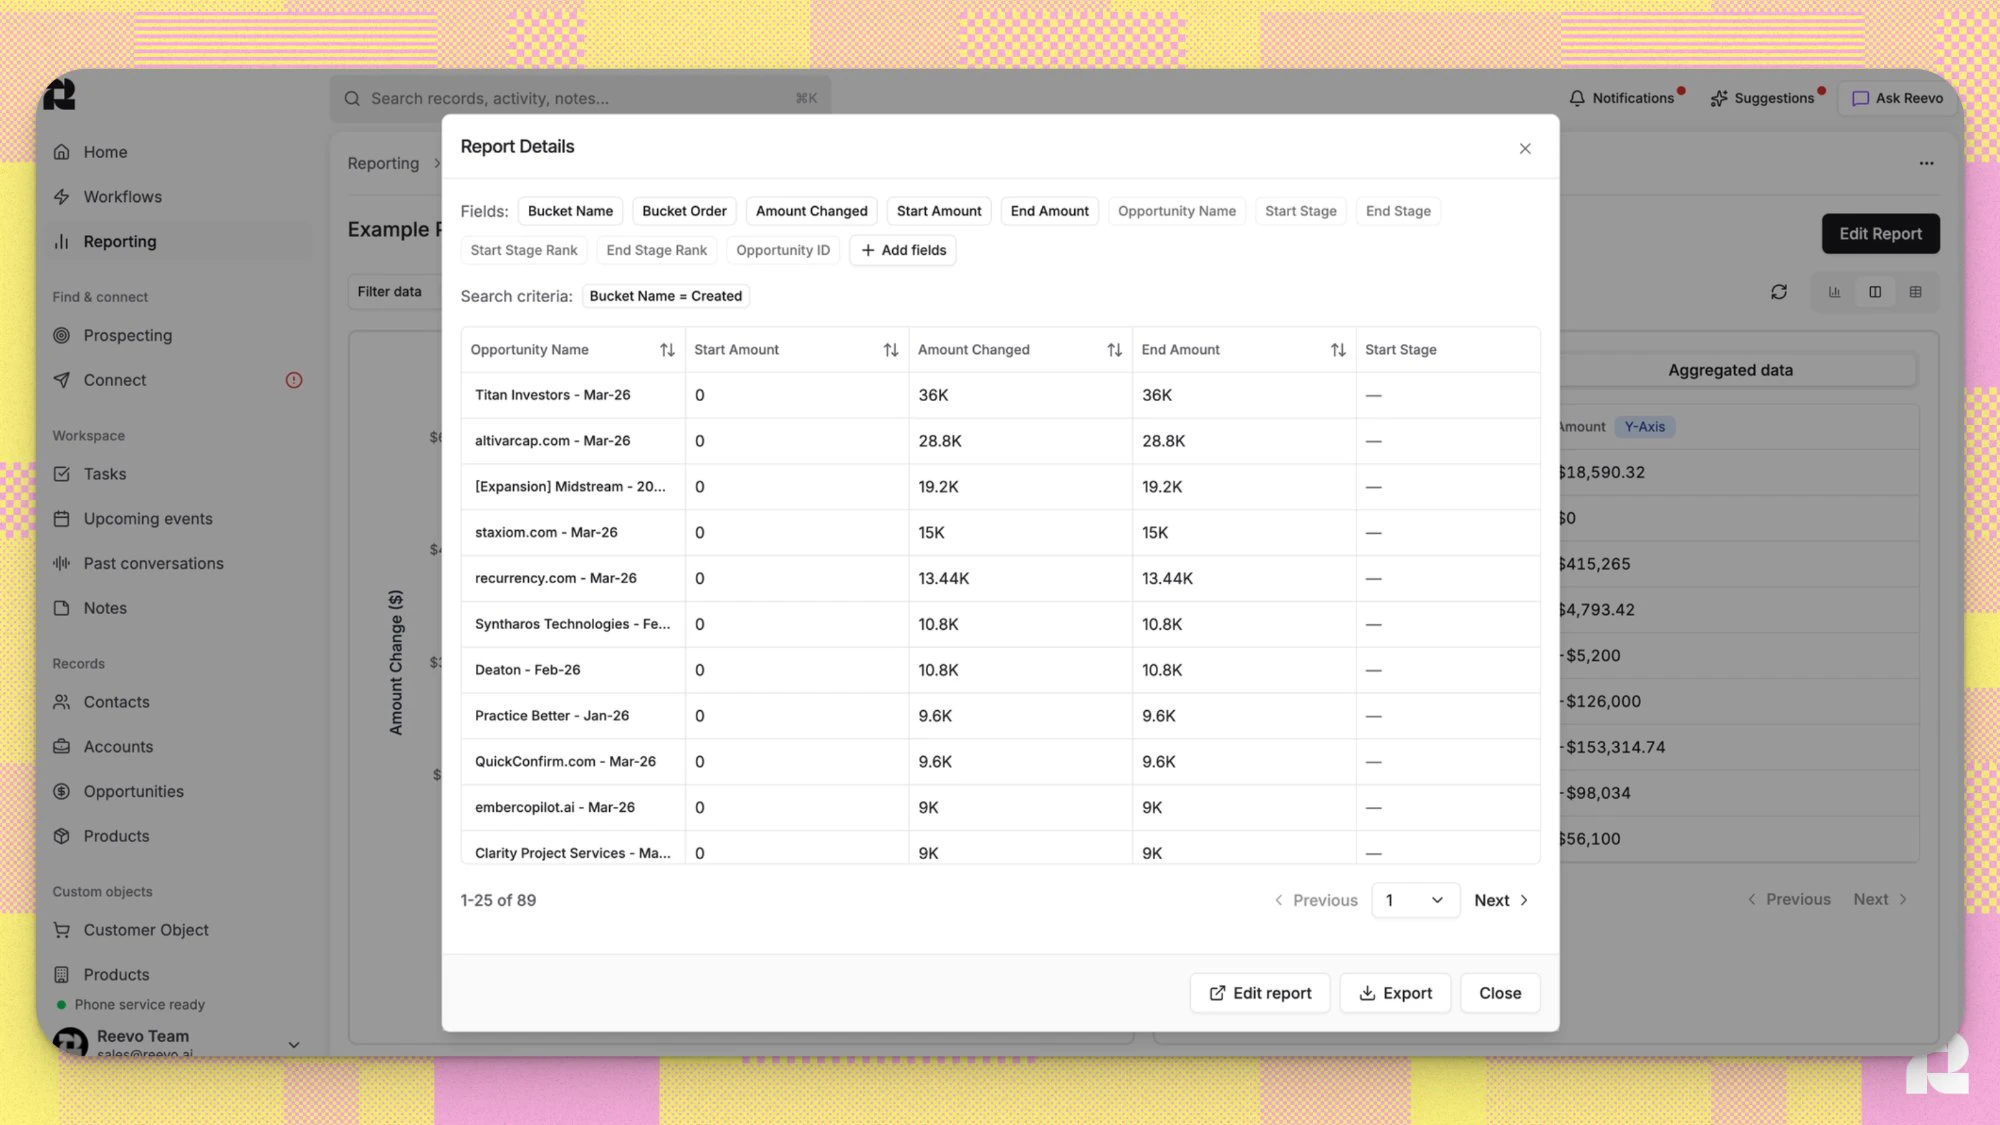 These columns appear by default:
| Column | What it shows |
| ---------------- | --------------------------------------------------- |
| Opportunity Name | The deal name |
| Start Amount | The deal's amount at the start snapshot |
| Amount Changed | The signed dollar contribution to the waterfall bar |
| End Amount | The deal's amount at the end snapshot |
| Start Stage | The deal's stage at the start snapshot |
| End Stage | The deal's stage at the end snapshot |
To add more columns, use **Additional Fields** in the report builder.
**How Amount Changed is calculated per bucket:**
| Bucket | Amount Changed |
| ---------------- | --------------------------------------------------------- |
| Start | = Start Amount |
| Created | = End Amount (Start Amount is 0 - deal did not exist yet) |
| Pulled In | = Start Amount |
| Amount Increased | = End Amount - Start Amount |
| Amount Decreased | = End Amount - Start Amount (negative) |
| Pushed Out | = -End Amount |
| Lost | = -End Amount |
| Won | = -End Amount |
| Unchanged | = 0 |
| End | = End Amount |
## Styling Options
Under **Styling** in the report builder:
| Option | Default | What it does |
| ---------------- | ------- | ----------------------------------------------------------------- |
| Show data labels | On | Displays compact USD amounts above each bar (e.g., \$42k, \$1.2M) |
| Show legend | On | Shows the Increase / Decrease / Total color key |
| Show grid | On | Horizontal grid lines behind the bars |
| Show tooltips | On | Hover a bar to see the exact dollar value |
***
# Troubleshooting / FAQ
Yes. A deal appears in every bucket that applies to it. For example, a deal that was pulled into the window and then closed lost during the same period appears in both Pulled In and Lost. The signed amounts are additive, so the waterfall balance still holds.
The chart shows net change only - the deal's amount at the start snapshot compared to its amount at the end snapshot. Intermediate changes are not surfaced individually. For example: a deal that went \$100k - \$150k - \$120k shows as Amount Increased with a +\$20k delta.
Unchanged deals contribute \$0, so there is no bar to render. Switch to **Table view** to see Unchanged deals and their deal count.
This happens when a deal's close date entered the close date window mid-period rather than being in-window from the start. Because the deal was not part of the starting pipeline, it had no amount recorded at the start snapshot, so Start Amount is \$0.
The Pipeline Waterfall chart type is pre-wired to the Pipeline Waterfall dataset. The bucket logic, signed amounts, and chart rendering depend on that dataset's structure and cannot be decoupled from it.
These columns appear by default:
| Column | What it shows |
| ---------------- | --------------------------------------------------- |
| Opportunity Name | The deal name |
| Start Amount | The deal's amount at the start snapshot |
| Amount Changed | The signed dollar contribution to the waterfall bar |
| End Amount | The deal's amount at the end snapshot |
| Start Stage | The deal's stage at the start snapshot |
| End Stage | The deal's stage at the end snapshot |
To add more columns, use **Additional Fields** in the report builder.
**How Amount Changed is calculated per bucket:**
| Bucket | Amount Changed |
| ---------------- | --------------------------------------------------------- |
| Start | = Start Amount |
| Created | = End Amount (Start Amount is 0 - deal did not exist yet) |
| Pulled In | = Start Amount |
| Amount Increased | = End Amount - Start Amount |
| Amount Decreased | = End Amount - Start Amount (negative) |
| Pushed Out | = -End Amount |
| Lost | = -End Amount |
| Won | = -End Amount |
| Unchanged | = 0 |
| End | = End Amount |
## Styling Options
Under **Styling** in the report builder:
| Option | Default | What it does |
| ---------------- | ------- | ----------------------------------------------------------------- |
| Show data labels | On | Displays compact USD amounts above each bar (e.g., \$42k, \$1.2M) |
| Show legend | On | Shows the Increase / Decrease / Total color key |
| Show grid | On | Horizontal grid lines behind the bars |
| Show tooltips | On | Hover a bar to see the exact dollar value |
***
# Troubleshooting / FAQ
Yes. A deal appears in every bucket that applies to it. For example, a deal that was pulled into the window and then closed lost during the same period appears in both Pulled In and Lost. The signed amounts are additive, so the waterfall balance still holds.
The chart shows net change only - the deal's amount at the start snapshot compared to its amount at the end snapshot. Intermediate changes are not surfaced individually. For example: a deal that went \$100k - \$150k - \$120k shows as Amount Increased with a +\$20k delta.
Unchanged deals contribute \$0, so there is no bar to render. Switch to **Table view** to see Unchanged deals and their deal count.
This happens when a deal's close date entered the close date window mid-period rather than being in-window from the start. Because the deal was not part of the starting pipeline, it had no amount recorded at the start snapshot, so Start Amount is \$0.
The Pipeline Waterfall chart type is pre-wired to the Pipeline Waterfall dataset. The bucket logic, signed amounts, and chart rendering depend on that dataset's structure and cannot be decoupled from it.